Visualising a data viz conference
On OpenVisConf and sketchnoting
I recently attended OpenVisConf (the conference for opensource data visualisation) in Paris. I was super excited as I had followed the conference from afar (it used to be in Boston) for a few years.
![]()
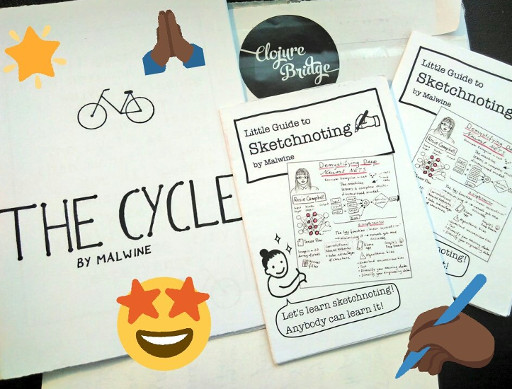
Another thing I’m excited about since I discovered it a little while ago is sketchnoting.
Sketchnoting is the process of taking visual notes. And some people use it to communicate technical information. I’m particularly inspired by my friend and badass coder/artist/sketchnoter Malwine who often sketchnotes tech conference talks and awesome Linux “sorceress” Julia Evans who sketchnotes to share technical topics she learns about.
Since I had a conference coming up, and one about a visual subject, I thought it would be a good time to try out sketchnoting.
How did I prepare for Sketchnoting at a conference?
I love data visualisations and maps and I’m a visual learner. I believe sharing information visually makes a lot of sense and that’s definitely part of my professional goals.
This is why I (attended this conference and) want to learn to sketchnote, but behind quite impatient I wanted to do it well (enough) on my first trial. This means I would have had to prepare, by watching a conference talk video and sketchnote at home. Indeed sketchnoting live (during a talk) means you need to be fast and improvise as you don’t know how much of the paper you’ll need and what part of the talk to highlight.
Unfortunately I wasn’t organised enough to rehearse before the conference. But I was lucky to get a sketchnoting guide zine from Malwine :)
I also had a motivating discussion with fellow Stockholm based developer friend Mariana who shared her experience of starting to sketchnote at EuroClojure 2017.
Basically I needed to accept I wasn’t going to do great at first, but I’d improve over time. And I shouldn’t worry too much right now about the medium and pens/pencils. I should just be careful about the disposition of info and try different fonts, shapes and colours to make the content more understandable and appealing.
How did it go??
So coming at the conference I tried to take it easy and just create a better versions of notes I would normally take. I used the notebook and pen from the conference swag bag. I stressed connections using arrows, and highlighted important things by uppercasing, underlining or drawing a shape around the words.
What happened was:
- I got disappointed and discouraged because it didn’t look like what I wanted to produce
- It didn’t always felt right to be taking notes. Sometimes I just wanted to listen to the talks (the amazing “Disagreements” talk by Amanda Cox and Kevin Quealy was a good example of that)
- I didn’t know how to represent talks filled with so many beautiful visual elements which added to the discouragement
- I got tired
How I solved my issues:
- I missed a talk to sit down, relax and try to improve on my notes, then sent a picture to Mariana who gave me useful and very encouraging feedback :)
- I went back to the conference talks with less pressure and took notes when it felt right to do so
- I sat at home after the conference and added colours and drawings to make my notes more visual and tweeted the outcome
Here are my fave ones from what I did for OpenVisConf:
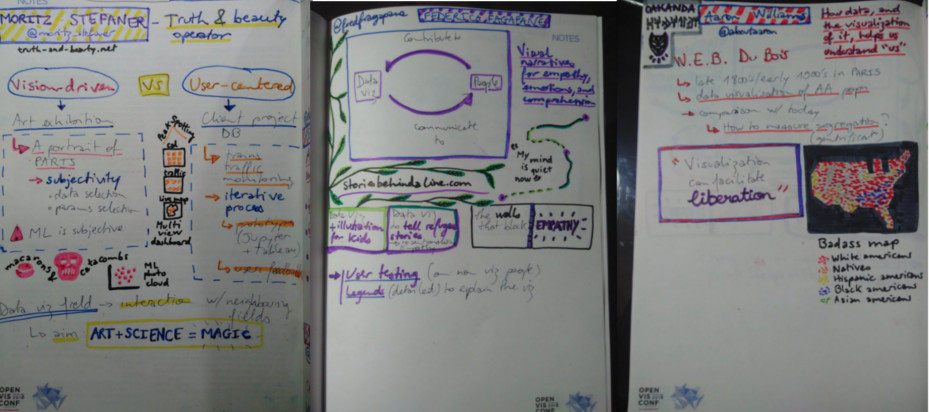
Adding small drawings was a good compromise (especially because the need to represent the visual aspects of the talk accurately faded with time). And I got positive feedback :)
How would I do it better next time?
Tools
I resisted the temptation to buy more pens and I’ll make do with what I have (regular blue or black writing pen and Crayola colouring pens I had bought for lettering).
Preparation
I’d like to think I’ll prepare myself by reading the abstracts of the talks beforehand and preparing the names of speakers and talk titles in a notebook.
Unfortunately I doubt this will happen :-/
Advice
I’m such a sketchnoting noob, but the advice I’d give someone interested is to experiment with different styles and tools to produce something you like best. I know I will experiment more from now on!
More importantly take it easy, you don’t have to sketchnote all the talks but you have to have fun and enjoy the conference :)
Conclusion
Sketchnoting is awesome! You can share your creations by posting pictures on social media and even create zines that you can print and share!! Come on, I can’t be the only one excited about zines!
Also at the “1, 2, 3 DATA” exhibition that presents all types of data visualisation projects I discovered a data visualisation zine called Market Cafe Mag
Resources
Some cool sketchnoters
-
Fellow
#sketchnotesand @sketchnoteclub on Twitter - Malwine is on Twitter at @malweene and you can see examples of her sketchnotes on her website -> share her call for conferences with conference organisers
- Julia Evans is on Twitter at @b0rk and she makes zines you can find (and order!) on her website.
- Amy is also a great example of a coder gifted with artsy skills and who uses them to explain technical concepts. She’s on Twitter at @sailorhg and her pretty zines and merchs are on the BubbleSort website.
Data viz inspiration
- OpenVisConf was super inspiring to me! Here is a link to the talks videos on YouTube :)
- The opening keynote at OpenVisConf 2018 was made by Moritz Stefaner who presented a project part of the “1, 2, 3 DATA” exhibition in Paris. I went to see it and was very inspired as well! You can look at the collection of awesome data viz projects here